How Much Is Enough?
By Steven J. Grisafi, PhD.
There exist widely disparate viewpoints regarding the monthly bond purchase program of the European Central Bank. In an effort to increase the availability of currency throughout the nineteen member nations, collectively known as the Eurozone, the European Central Bank undertakes the purchase of institutional bonds amounting to sixty billion Euro Dollars, each month for the foreseeable future, until at least the end of this year. There is no expectation of any positive increase to the interest rates that are set by the Bank. From the viewpoint of most persons residing in Germany, and the Netherlands, this program of monetary accommodation has surpassed its intended goal and ought to be terminated. From the viewpoint of most others residing in the remaining seventeen nations, the program ought to continue as planned. So the question arises: Is there sufficient availability of currency within the Eurozone to meet the needs of its people?
To explore this question I examined the measure of currency known as M1. This measure of the wealth of an economy restricts itself to the forms of currency most readily available as cash. Other measures, such as M2 and M3, refer to more long term aspects of the wealth of an economy and consequently should be irrelevant to the goal of a central bank seeking monetary easing. Let us consider the M1 estimates provided by the central banks of Japan, and the United Kingdom, for contrast with that of the Eurozone. The United Kingdom has recently begun to experience some inflation greater than desired as one consequence of its decision to leave the European Union. Japan continues to subsist without the desired amount of inflation its central bank has sought for many years. Within the Eurozone, Germany and the Netherlands endure higher inflation than they would prefer, while the remainder of the Eurozone languishes with economic stagnation.
Each central bank reports its M1 estimate measured using its own currency. That is, the Bank of Japan reports its measure for M1 using the Yen, the Bank of England reports its measure using Pounds Sterling, and the European Central Bank reports using Euro Dollars. Before one can compare the three M1 estimates with one another two corrections need to be made. First, all M1 estimates must be converted to measurement by a single currency. Let us choose the United States Dollar as the common basis. The exchange rate varies as time progresses so each reported M1 estimate is converted to US Dollars with the exchange rate at the time of the reporting. For the most recent report of M1 estimates, occurring for the month of February 2017, the converted values are: $7728.84166 billion for the Eurozone; $2019.85854 billion for the United Kingdom; $6158.68590 for Japan. At first glance one may conclude that currency is more abundant in the Eurozone than in either Japan or the United Kingdom. However, when one considers that the cost of living in both Japan and the United Kingdom are not lower than anywhere within the Eurozone, one ought compare the M1 estimates on a per capita basis.
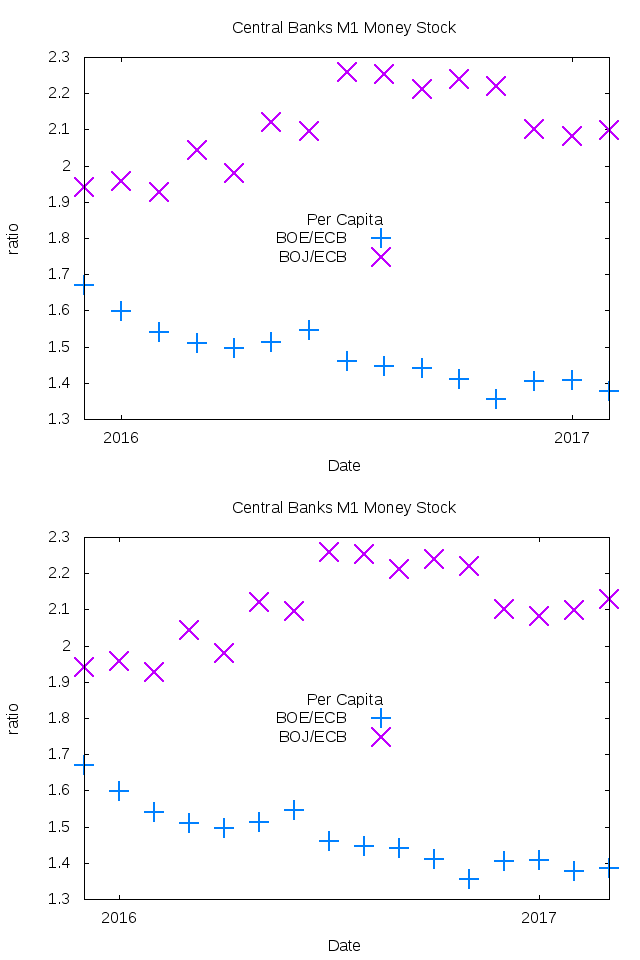
Based upon the latest estimates, secured in 2013, there are 340 million persons in the Eurozone; 64.1 million in the United Kingdom; and 127.3 million in Japan. After correcting the M1 estimates to a per capita basis, the ratio for the Bank of Japan (BOJ) estimate relative to that of the European Central Bank (ECB), and that of the Bank of England (BOE) relative to that of the ECB, some recent data is plotted below in figure one.
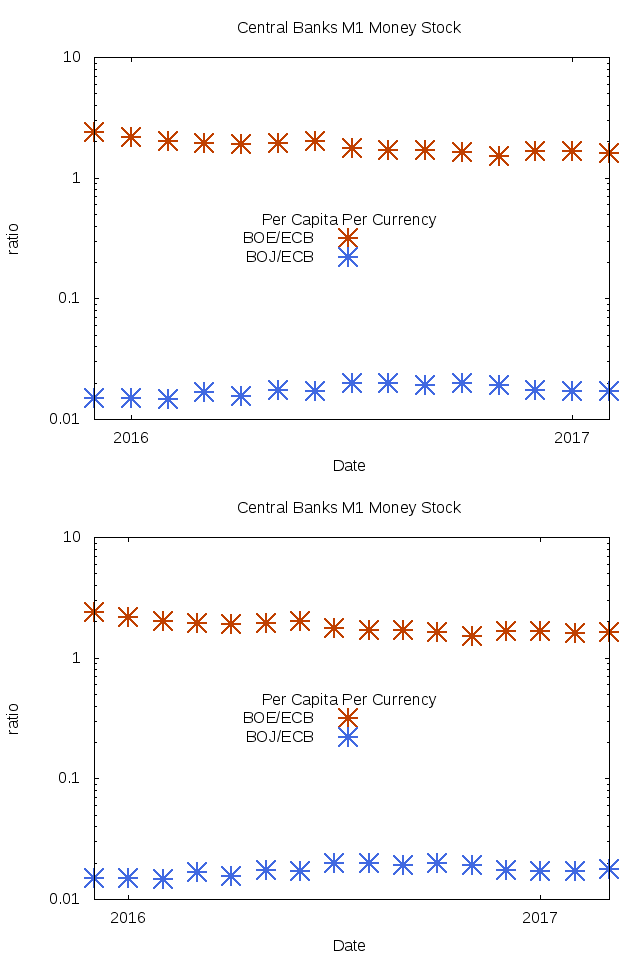
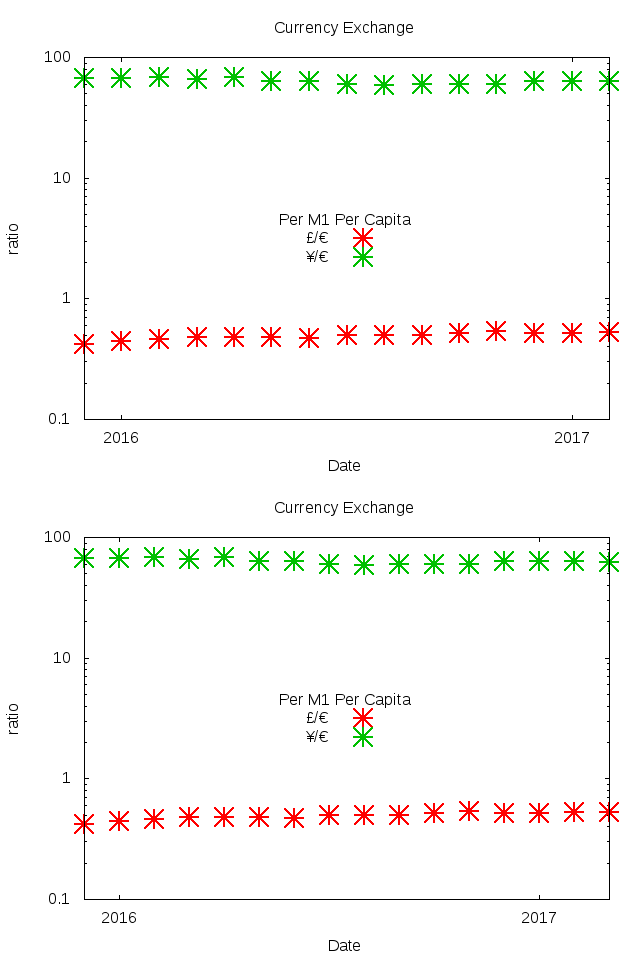
Inspecting the figure we see that the BOE capitalization is twice that for the ECB, while the BOJ capitalization exceeds that for the ECB by approximating fifty per cent, when measured on a per capita basis. If the cost of living in the United Kingdom were twice that of living in Germany then one might say that the central banks have achieved an appropriate capitalization of their respective economies. But the costs of living in Germany, England or Italy are not so different such that one could argue that the Eurozone is sufficiently capitalized. The difficulty resides in the fact that further capitalization of the Eurozone inflates prices in Germany but stimulates only modest economic activity elsewhere in the Eurozone. Figure two, shown below, scales the data points from that for figure one to account for the exchange rate ratio of the Pound Sterling to the Euro Dollar and for the Japanese Yen to the Euro Dollar. The graph is still showing M1 data. We now invert each data point within Figure Two and plot them as in Figure Three. The graph in Figure Three is now a plot of the ratios for currency exchange rates of the Pound Sterling with respect to the Euro Dollar and for the Japanese Yen relative to the Euro Dollar.
Figure Three is a graph of the currency exchange rates for the Pound Sterling and the Japanese Yen with respect to the Euro Dollar. But the data points are corrected to account for the differences in the M1 money stock and the population of persons using each money stock. Since the current raw exchange rate is approximating 0.87 Pounds for each Euro, and 120 Yen for each Euro, Figure Three would seem to indicate that one should get only about 0.52 Pounds and 62 Yen for each Euro Dollar. Thus, one would say that either the Pound Sterling and the Japanese Yen are undervalued or the Euro Dollar is overvalued. While this would give voice to the argument that the ECB has succeeded in providing increased availability of the Euro Dollar it fails to address the fundamental argument that a lack of homogeneity within the Eurozone renders all such macroscopic assessments as moot.


